
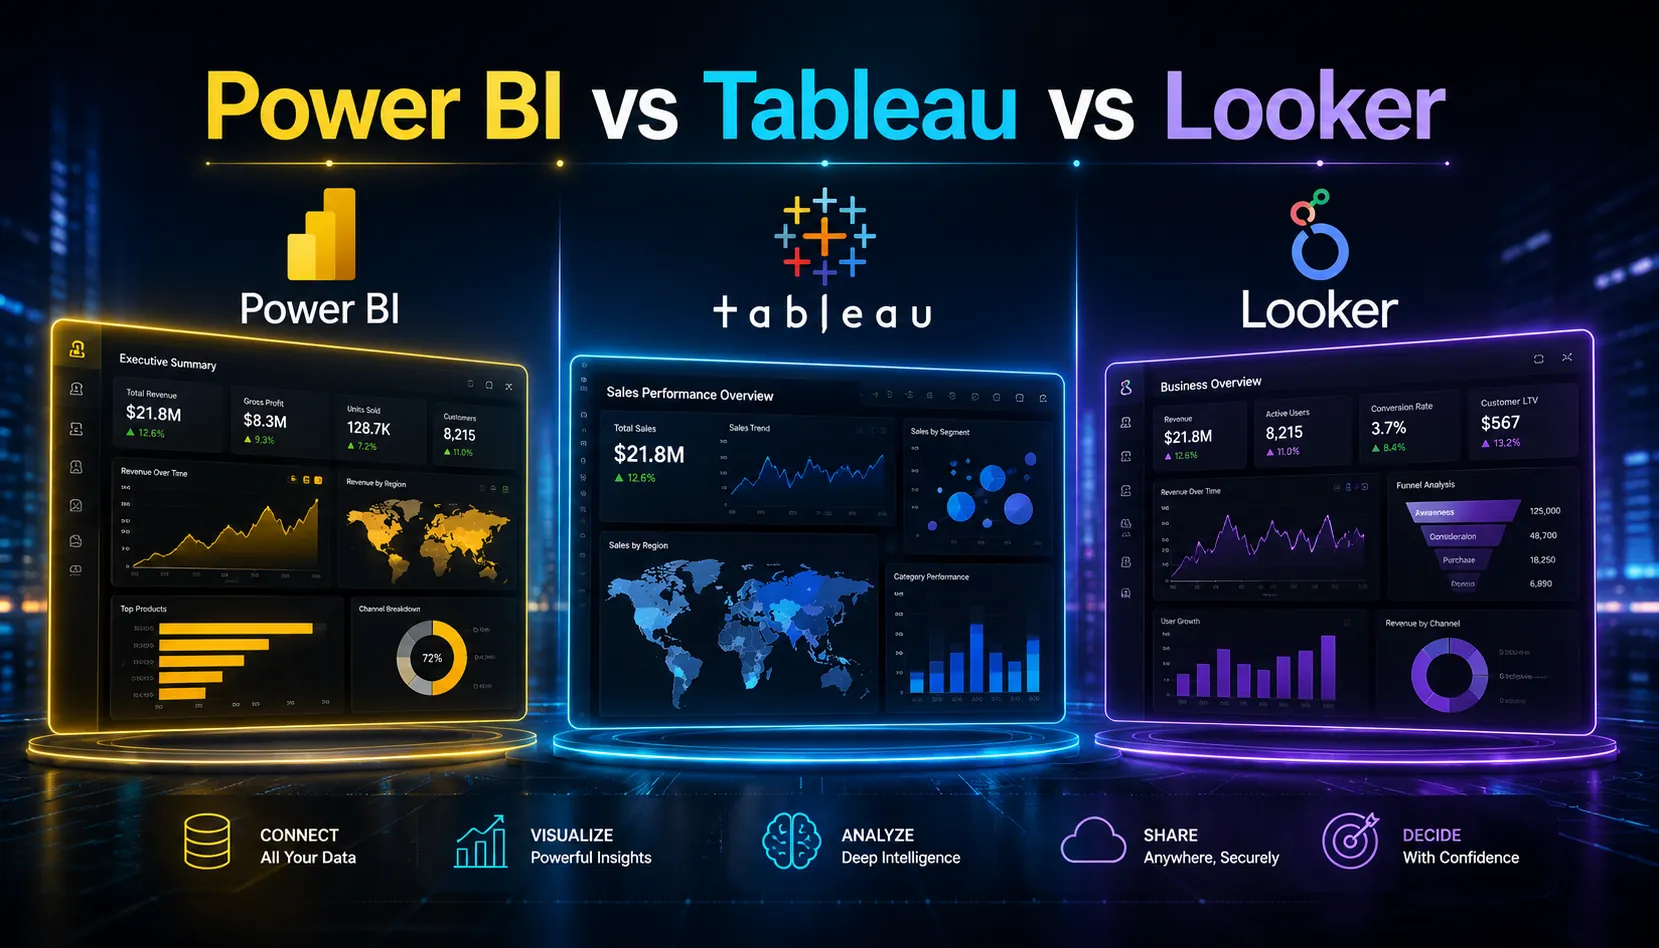
73% of organizations plan to increase BI spending in 2026. 68% admit their current platform does not deliver expected ROI. The problem is often a mismatch between the tool and the organization, not a failure of the tools themselves.
Power BI, Tableau, and Looker are all capable platforms in Gartner’s Leaders Quadrant. The decision between them is less about which is ‘best’ and more about which fits your team’s technical profile, your existing software ecosystem, and what kind of analytics work you actually need to do.
The Architecture Difference That Drives Everything Else
Power BI is built around Microsoft’s VertiPaq in-memory columnar engine and integrates natively with the Microsoft ecosystem: Excel, Azure, Teams, SharePoint. If your organization runs on Microsoft 365, Power BI is the path of least resistance.
Tableau is focused on visual analytics. Its core strength is the ability to create interactive, exploratory dashboards quickly. Users connect to data sources and explore with drag-and-drop, without needing to define a semantic data model first.
Looker is built around LookML, a data modeling language that defines a centralized semantic layer. All reports reference the same definitions. This creates a single source of truth and makes Looker the strongest option for data governance at scale. It sits natively in the Google Cloud ecosystem.
Pricing in 2026
| Platform | 2026 Pricing | Note |
| Power BI | Pro: $10/user/month | Premium Per User: $20/user/month | Premium (capacity): from $4,995/month | Most cost-effective for Microsoft-heavy orgs |
| Tableau | Viewer: $15/user/month | Explorer: $42/user/month | Creator: $75/user/month | Per-role pricing; Creator for full authoring access |
| Looker | Standard platform: ~$66,600/year (10 users) | Advanced: ~$132,000/year | Custom enterprise pricing | Designed for data teams; higher entry cost |
Three-year total cost of ownership including licensing, training, and integration: Power BI ranges from $10,000 to $85,000 for typical deployments, Tableau from $12,000 to $110,000, and Looker from $15,000 to $125,000. These ranges reflect company size and configuration rather than absolute product quality differences.
Strengths and Weaknesses
Power BI
Strengths: native Microsoft integration, lowest cost for Microsoft-heavy organizations, Copilot AI integration for natural language queries, familiar for Excel users, strong for self-service reporting.
Weaknesses: performance can degrade on very large datasets without Premium capacity, less polished visualization capabilities than Tableau, limited outside the Microsoft ecosystem.
Tableau
Strengths: best-in-class data visualization, intuitive drag-and-drop for non-technical users, strong connector library (100+ native data sources), Tableau Pulse delivers AI-generated summaries to Slack and email in 2026, preferred by data-mature analyst teams.
Weaknesses: higher cost than Power BI, governance and semantic modeling weaker than Looker, per-role pricing can become expensive when many users need Creator access.
Looker
Strengths: LookML semantic layer creates a single source of truth, best for governance at scale, ideal for embedding analytics in external products, strong in Google Cloud deployments, best for organizations where data consistency across reports is non-negotiable.
Weaknesses: highest entry cost, steeper learning curve for LookML, slower to produce ad-hoc exploratory analysis than Tableau, smaller community than Power BI or Tableau.
The Decision Framework
| Your Situation | Recommended Tool |
| Your organization runs on Microsoft 365 / Azure | Power BI: lowest friction, lowest cost, native integration with tools your team already uses |
| Your team needs powerful data visualization for executive reporting | Tableau: unmatched visualization quality and interactive dashboards |
| Data governance and consistency across teams is the primary concern | Looker: LookML semantic layer ensures consistent definitions across every report |
| Small business, limited budget, basic reporting needs | Power BI: most affordable entry point with sufficient capability for most SMB needs |
| Embedding analytics into your product or customer-facing application | Looker: strongest embedded analytics capabilities |
| Data-mature organization with dedicated analysts | Tableau or Looker: both designed for analyst-driven workflows |
The Honest Bottom Line
No single tool is objectively better. Power BI wins on cost and Microsoft integration. Tableau wins on visualization quality and analyst experience. Looker wins on governance and Google Cloud native deployment.
The most common mistake: choosing based on brand recognition or feature lists rather than organizational fit. A tool that integrates with your existing stack and your team’s technical level will always outperform a technically superior tool that nobody uses properly.
FAQ
Which BI tool is easiest to use in 2026?
Power BI is generally considered most approachable for organizations already using Microsoft tools, especially for Excel users. Tableau has an intuitive drag-and-drop interface that non-technical business users adapt to quickly. Looker requires understanding LookML and is designed for technical data teams.
When should I choose Looker over Power BI or Tableau?
When data governance is the top priority, when you need a single source of truth that all reports reference consistently, when you are deeply embedded in Google Cloud infrastructure, or when you need to embed analytics directly into your own product.
What is the total cost difference between Power BI and Tableau?
For most deployments, Power BI is 30 to 50% less expensive than Tableau when comparing equivalent configurations. Tableau Creator seats at $75 per user per month compare to Power BI Pro at $10 per user per month. However, for Microsoft-heavy organizations, Power BI Premium capacity licensing can become more expensive than Tableau at very large scale.
The right analytics platform turns data into actionable insights. WritoryBuzz creates expert-driven technology and business content that helps organizations understand complex tools, evaluate solutions, and make smarter decisions.