
Picture a 400 dollar monitor with a red tag that says ‘was 599 dollars, now 399.99 dollars’. Before you click buy, one question decides whether that is a deal: what did the monitor cost last month? A price history tracker answers it in about ten seconds, and it is the single most useful habit for Black Friday.
The case for checking is strong. A Which? investigation of 201 UK Black Friday deals from 2020 found that 99.5 percent were the same price or cheaper at other times of the year, and only one product was at its lowest price on the day. A tracker is how you see this for yourself, and it sits alongside our guide to fake Black Friday deals and price tricks and the wider Black Friday explainer.
Which Price History Tool Should You Use?
There are many trackers, and the right one depends on where you plan to shop. We checked one in detail through Clark.com’s guide, updated on 30 December 2025, and the rest are described only at the level we could confirm.
| Tool or method | What it covers | What we confirmed |
|---|---|---|
| CamelCamelCamel | Amazon.com only | Price history charts, email alerts at a target price, browser extension (The Camelizer) for Chrome, Edge, Firefox, Opera and Safari, free to use without an account |
| Keepa | Amazon, widely used | We did not test it for this post; check its current features before relying on it |
| Retailer wish lists and alerts | Varies by store | Many stores send price drop emails for saved items; confirm on each store |
| Your own sheet | Any store | Our suggestion: note price and date for 4 to 5 key items every few days |
The comparison is based on what Clark.com confirmed about CamelCamelCamel; Keepa and retailer features change often, so test them yourself.
How Do You Read a Price History Chart?
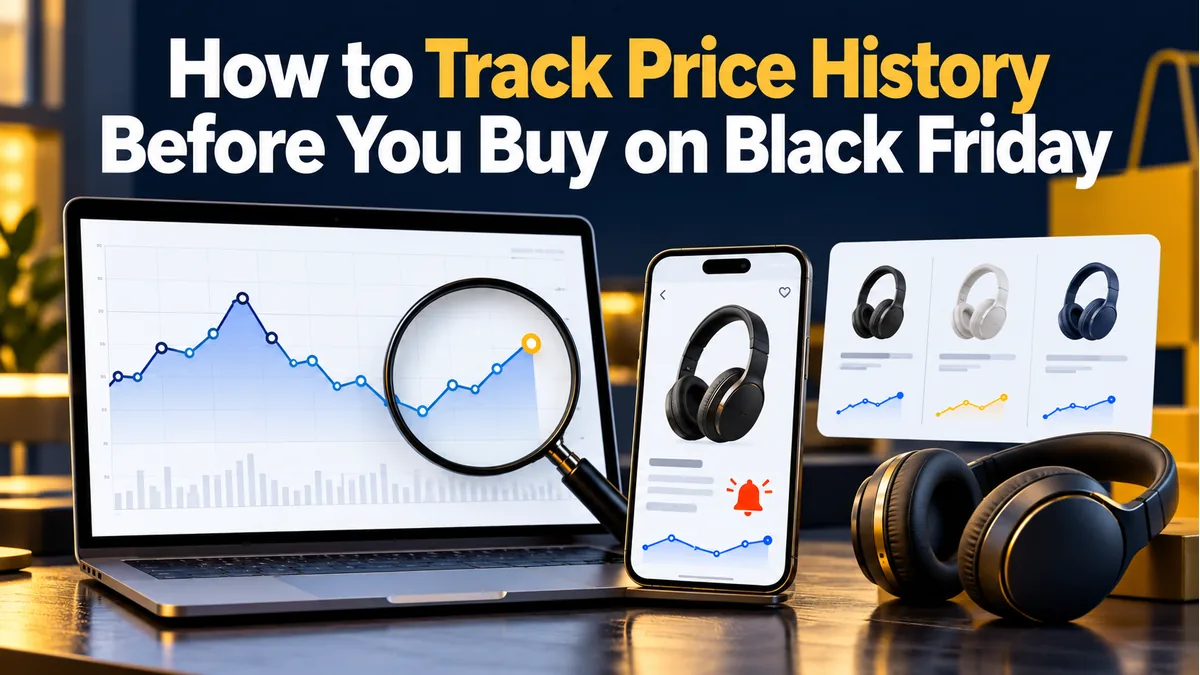
Clark.com explains that CamelCamelCamel plots price on the vertical axis against months and years on the horizontal axis, with different coloured lines for each seller type: green for Amazon’s own new-condition price, blue for third-party new and red for third-party used. Dotted segments mark periods when the item was out of stock. A table below the chart lists the highest and lowest prices by seller and compares the current price with the average.
| What you see on the chart | What it likely means | What to do |
|---|---|---|
| Current price equals the lowest ever | A strong price | Buy if you need it |
| Current price is well above the average | Not much of a deal | Set an alert and wait |
| Price spikes then falls just before the sale | The ‘was’ price may be inflated | Compare with the pre-spike price |
| Dotted gap | Item was out of stock | Do not read the missing line as a price drop |
| Only third-party lines are low | Price may come from a marketplace seller | Check ratings, history and return policy |
The last row echoes Clark.com’s advice to vet third-party used sellers by ratings, history and return policy.
How Do You Set Up a Price Alert in Four Steps?
Using CamelCamelCamel as the example, the steps below follow Clark.com’s description.
| Step | Action |
|---|---|
| 1 | Open the product’s page on the tool, or use the browser extension while on the Amazon product page |
| 2 | Look at the chart and note the lowest and average prices by seller |
| 3 | Enter your email address and a target price in the Price Watch box above the graph |
| 4 | Wait for the email; before buying, re-check the seller, shipping cost and return terms |
Choose your target price from the chart, not from the advertisement. A sensible target is near the product’s previous low, adjusted for how badly you need it.
What If a Store Does Not Have a Tracker?
Most stores are not covered by Amazon tools. A simple method, which is our suggestion and not a tested system, is to save the item to a wish list or cart in October, screenshot the price with the date, and record the price in a sheet every few days. By Black Friday you will have your own price history for the few items that matter.
If the item is consumer tech, our guide to Black Friday tech deals worth waiting for shows which categories tend to fall furthest. For a category-by-category verdict, read the guide to the best Black Friday deals to wait for.
Can You Trust Every Tracker Result?
No tool sees everything. Clark.com notes that CamelCamelCamel covers Amazon.com only, so a rival retailer may have sold the same item for less. The article says its screenshots date from 2019, so the interface may have changed. Treat the chart as strong evidence, not proof, and compare at least two sellers.
Also check that you are buying the same model. Retailers sometimes sell a similar-looking version made for a sale, with a different model number. Compare the model number on the tracker with the one on the product page, and follow the safety steps in our online shopping safety checklist.
How Does Price History Fit Into Your Black Friday Plan?
It is Step 3 of our Black Friday shopping guide for beginners. Run it in the first week, set alerts for 3 to 5 items, then let the sales come to you. If an Amazon event is part of your plan, see what we know in the post on Amazon Black Friday deals in 2026, and avoid the traps listed in Black Friday mistakes that cost shoppers money.
What Does a Real Price History Look Like? A Worked Example
The chart below is invented to show how to read the numbers. It is not real data for any product.
| Month (example) | Price of a pair of headphones |
|---|---|
| July | 129 dollars |
| August | 129 dollars |
| September | 119 dollars |
| October | 149 dollars |
| Black Friday sale | 119 dollars, marked ‘was 149 dollars’ |
The ‘was’ price of 149 dollars comes from October, but the item cost 119 dollars in September and 129 dollars in the summer. The sale price only matches September, so it is not a bargain, just a return to a normal price. If your target was 110 dollars, you would keep waiting.