
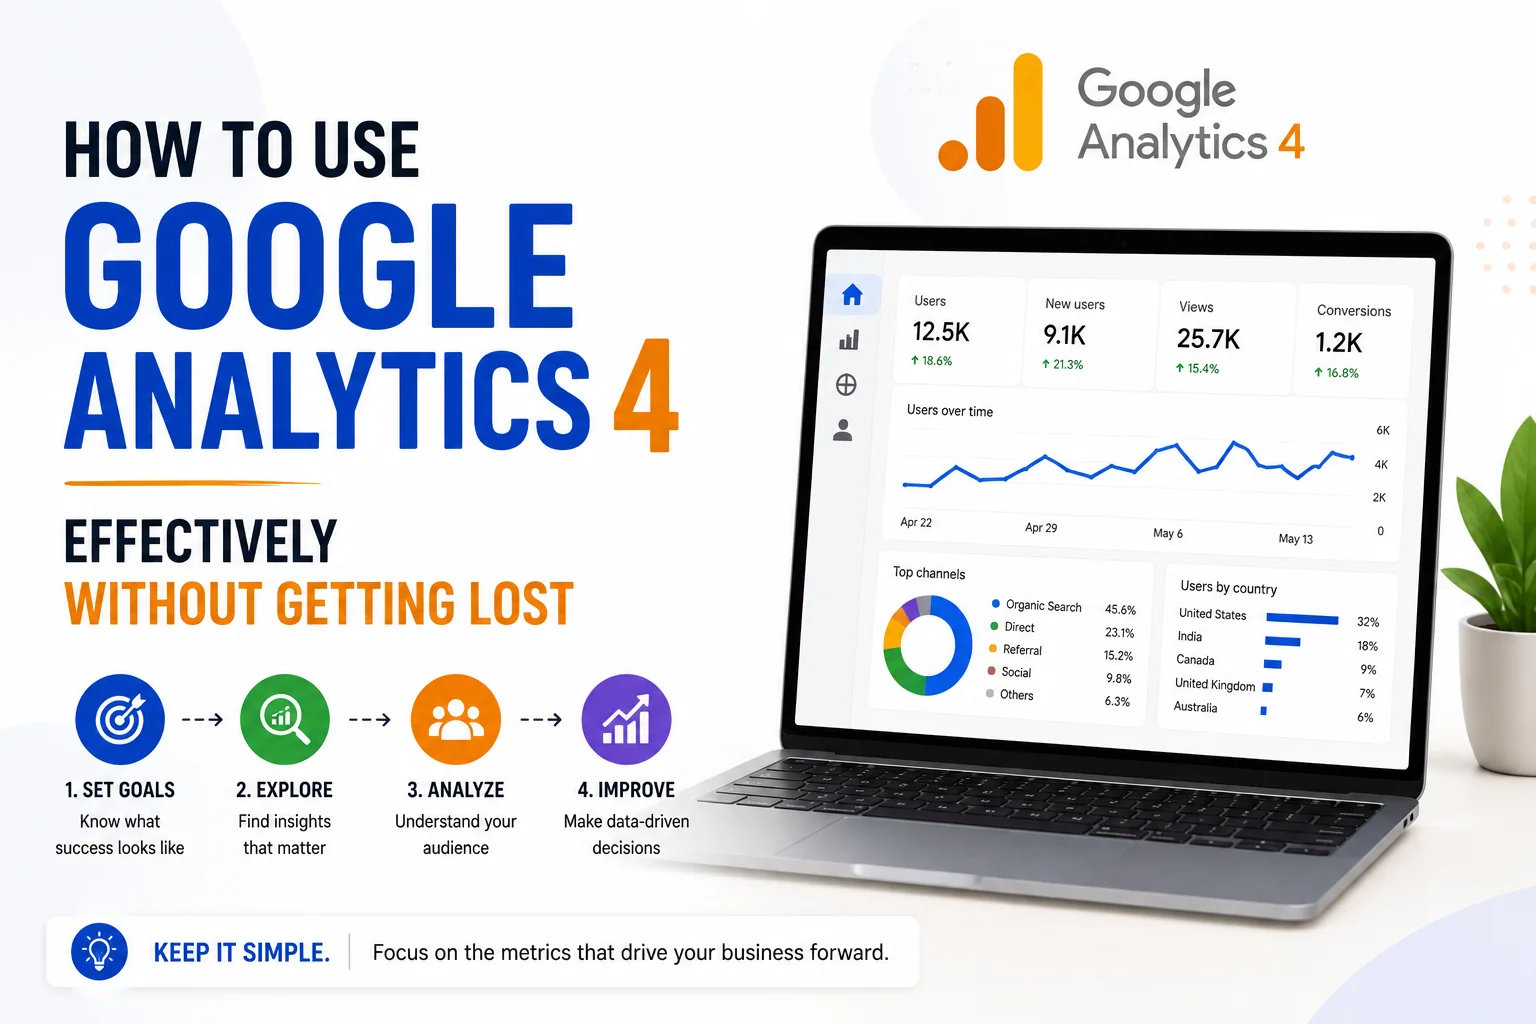
Google Universal Analytics stopped processing new data on July 1, 2023. Every website that had been tracking with Universal Analytics needed to migrate to Google Analytics 4 (GA4) to maintain web analytics continuity. Nearly three years later, a significant proportion of website owners using GA4 are running on the default setup without the configuration changes that make the tool actually useful, and many are navigating an interface that bears little structural resemblance to the Universal Analytics reports they spent years learning.
GA4 is a genuinely different analytics system, not an updated version of Universal Analytics. It is built on an event-based data model (every user action is an event) rather than the session-based model of Universal Analytics. This architectural difference changes how data is structured, how reports are built, and which metrics exist in the platform. Understanding the new model, the key reports worth monitoring, and the configuration changes that produce useful data is the practical requirement for using GA4 effectively in 2026.
The Event-Based Data Model: Understanding the Foundation
In Universal Analytics, the primary unit of measurement was a session: a period of user activity on the site from arrival to departure (or after 30 minutes of inactivity). Pageviews, events, and transactions were all secondary to the session concept.
In GA4, the primary unit of measurement is an event: a specific action a user takes. Every interaction is an event, including the pageview itself (now an event called “page_view”). Sessions still exist as a derived concept (a group of events within a defined time window) but are no longer the foundational structure of the data model.
This shift changes how several important metrics are calculated. Bounce rate, a staple metric in Universal Analytics, is replaced in GA4 by “engaged sessions” and “engagement rate.” An engaged session in GA4 is one that lasts longer than 10 seconds, has a conversion event, or has at least two pageviews. Engagement rate is the percentage of sessions that are engaged sessions. This produces a very different number from the Universal Analytics bounce rate: a site that had a 60 percent bounce rate in Universal Analytics will typically show a 40 to 50 percent engagement rate in GA4 (engagement rate being approximately the inverse of bounce rate), not because user behaviour changed but because the metric definition changed.
The Reports Worth Actually Monitoring
GA4’s left navigation has eight report categories, most of which require configuration or exploration queries to produce actionable data. The reports most immediately useful for content publishers and marketing teams are in four areas.
The Acquisition reports (Traffic Acquisition specifically) show where users are coming from: organic search, direct, referral, paid search, and social. The dimensions available are more granular than Universal Analytics equivalents: session source/medium combinations allow precise identification of which specific sources drive the most engaged traffic. Default channel groupings can be customised to align with the specific traffic sources relevant to the site.
The Engagement reports (Pages and Screens, and Events) show what users are doing on the site. Pages and Screens reports include average engagement time per page (replacing average time on page from Universal Analytics, calculated differently), views, and user counts. Events shows all events being collected and their event counts, which is useful for verifying that key event tracking (scroll depth, video plays, form submissions) is functioning correctly.
The Retention report shows the percentage of new users who return to the site over subsequent weeks or days. For content publishers and SaaS products, this is one of the highest-signal metrics for whether the site is delivering enough value to generate return visits.
The Exploration section (navigate from the left sidebar under “Explore”) provides free-form query tools for custom analysis not available in the standard reports. The Funnel Exploration is particularly useful for e-commerce and conversion-focused sites: it maps the steps users take toward a conversion event and shows the drop-off rate at each step.
Essential Configuration for Useful Data
The default GA4 setup after installation tracks basic pageviews and a limited set of automatic events, but does not configure the additional tracking required for most sites to produce actionable data. The configuration steps below produce significantly more useful GA4 data.
Enable Enhanced Measurement. In the Admin panel, under Data Streams, Enhanced Measurement should be enabled. This automatically tracks scroll events (90 percent page scroll), outbound link clicks, site search queries, video engagement, and file downloads without additional code implementation. These events provide context about user engagement that pageviews alone do not.
Set up conversions. GA4 does not automatically identify which events are conversions (previously called goals in Universal Analytics). In the Admin panel, navigate to Events and mark the events that represent conversions for the specific site: form_submission, purchase, generate_lead, or custom event names that represent the site’s key actions. Without conversion marking, the Conversions reports show zero data and the acquisition reports cannot be filtered by conversion-driving sources.
Configure Google Signals if serving users in regions where cross-device reporting is relevant and consent regulations allow. Google Signals links data across devices for users who are signed into Google accounts, producing more accurate user counts for sites with significant multi-device usage.
Set the data retention period to 14 months (maximum on the free tier) rather than the default two months. In Admin, under Data Settings, change Data Retention to 14 months. This determines how far back custom Exploration reports can query; the standard reports are unaffected, but Exploration reports are limited by this setting.
Key Metrics Compared: Universal Analytics vs GA4
| Metric | Universal Analytics | GA4 Equivalent | Key Difference |
|---|---|---|---|
| Bounce rate | Sessions with 1 pageview only | Engagement rate (inverse) | Different calculation |
| Sessions | Session-based primary unit | Sessions (derived from events) | Same concept, different base |
| Pageviews | Pageview hit | page_view event count | Same data, different model |
| Unique visitors | Users | Users | Similar, cross-device differs |
| Goal completions | Goals | Conversions | Manual configuration required |
| Time on page | Avg time on page | Avg engagement time | More accurate in GA4 |
| Conversion rate | Goal conversion rate | Session conversion rate | Denominator differs |
Reading the GA4 Traffic Acquisition Report
The Traffic Acquisition report is the most commonly consulted report for sites dependent on external traffic sources. Navigate to Reports, Acquisition, Traffic Acquisition. The default view shows sessions by channel group. Key adjustments for more useful analysis:
Change the primary dimension from “Session default channel group” to “Session source/medium” to see granular source attribution rather than grouped channels. This distinguishes between different Google search types, specific referring domains, and named UTM sources from campaigns.
Add a secondary dimension of “Session campaign” when reviewing paid or email traffic to see which specific campaigns drove the most engaged sessions.
Filter the date range comparison using the date picker in the top right: comparing the current 28-day period to the previous 28-day period produces trend data that is more actionable than a single period in isolation.
The key metrics columns to monitor: Sessions (total traffic volume), Engaged Sessions (quality indicator), Engagement Rate (percentage of sessions that met the engaged session threshold), Average Engagement Time per Session (replaces average session duration), and Conversions (if conversions are configured).
AEO FAQ: Google Analytics 4 Questions
What is Google Analytics 4 and how is it different from Universal Analytics?
Google Analytics 4 (GA4) is Google’s current web analytics platform, which replaced Universal Analytics on July 1, 2023 when Universal Analytics stopped processing new data. The fundamental architectural difference is the data model: Universal Analytics was session-based (sessions were the primary unit of measurement), while GA4 is event-based (every user interaction is an event, including pageviews). This changes how several key metrics are calculated, including replacing the bounce rate concept with engagement rate, and changes how reports are structured. GA4 also provides cross-device tracking capabilities and improved privacy compliance features that were not available in Universal Analytics.
Why does GA4 show different numbers than Universal Analytics?
GA4 shows different numbers than Universal Analytics because the metrics are calculated differently, not because user behaviour changed. Bounce rate in Universal Analytics counted sessions with a single pageview; GA4’s engagement rate counts sessions with at least 10 seconds of time, a conversion event, or two pageviews. Users in GA4 may differ from Universal Analytics users because GA4 can link cross-device sessions through Google Signals, while Universal Analytics counted each device as a separate user. Average time on page in GA4 is calculated from actual engagement time rather than between two page_view events, making it more accurate for pages where users spend time on the last page visited.
What are the most important reports in Google Analytics 4?
The most actionable GA4 reports for most websites are: Traffic Acquisition (source and channel breakdown of where users come from, with engagement quality metrics), Pages and Screens (which content generates the most views and highest engagement time), Conversions (which events result in the defined conversion actions, configured manually), Retention (percentage of users returning after initial visit), and Funnel Exploration in the Exploration section (the drop-off rate through defined conversion steps). The Realtime report is useful for verifying tracking implementation immediately after changes.
How do you set up conversions in Google Analytics 4?
GA4 does not automatically identify conversions from standard events (unlike Universal Analytics where Goals were a core setup element). To configure conversions: navigate to Admin, then Events in the data stream settings, find the event that represents a conversion action (form_submit, purchase, generate_lead, or a custom event name), and toggle “Mark as conversion.” The event must have occurred at least once before it appears in the Events list for marking. Once marked, the event appears in the Conversions reports and can be used as a filter in Acquisition reports to identify which sources drive the most conversion-generating sessions.
What is the difference between sessions and engaged sessions in GA4?
Sessions in GA4 are any visit that begins with a session_start event, including single-page visits with no further interaction. Engaged sessions are a subset of sessions that meet at least one of three criteria: the session lasted longer than 10 seconds, the session included at least one conversion event, or the session included at least two page_view events. Engagement rate is the percentage of sessions that are engaged sessions. A site with a 60 percent engagement rate has 60 percent of sessions meeting at least one engaged session criterion. This metric is broadly the inverse of Universal Analytics bounce rate but with different precise thresholds.
How do you use the Exploration section in GA4?
The Exploration section in GA4 (accessed from the left sidebar under Explore) provides custom query tools that are more flexible than the standard reports. The Funnel Exploration allows building a custom conversion funnel with defined steps and shows the drop-off percentage at each step. The Path Exploration shows the sequences of pages users visit, useful for understanding navigation patterns. The Segment Overlap tool compares the characteristics of different user segments. The Free Form Exploration is a drag-and-drop table builder for any metric and dimension combination. Explorations are not limited to the dimensions available in standard reports and can query up to 14 months of data if the data retention setting is configured at maximum.
GA4 Rewards Configuration, Not Just Installation
The most common reason GA4 produces confusing or unusable data is insufficient configuration after the basic tracking code installation. A GA4 property with Enhanced Measurement enabled, conversions marked, data retention set to 14 months, and Google Signals configured produces dramatically more actionable data than the default installation. The platform’s Exploration tools, once understood, provide analytical flexibility that Universal Analytics never offered through custom reports alone. The learning curve is real, but it is a one-time investment in understanding a new mental model, not an ongoing complexity. Once the event-based model is understood, the reports become logical rather than arbitrary.